Market Commentary Q1
If you’re up to date on economic news, you’ve certainly heard or read of investors and economists alike arguing over the yield curve - which isn’t out the ordinary, especially when the economy begins to slow. The reason is that when the curve dips below zero, investors see it as a sign of a looming recession. But why do investors care about this curve? What exactly is the yield curve?
To understand the yield curve, it is paramount that you first understand bonds. Bonds are a sum of money that an investor will lend to a company or government with the promise that the investor will be paid interest over a certain period of time, with the principal repaid upon maturity. The interest is the amount of money which the investor earns annually, also known as yield.
The yield curve is the measurement of all bonds the treasury is selling for a certain length of time. The yield curve is two parts, the x-axis depicts the maturity of the bonds and when the bonds will be repaid. The y-axis measures the yield; the interest the bond holders receive annually. A yield curve is normally upward sloping, showing that the economy is growing and expanding. A healthy market has long-term bonds trading at higher yields than the short-term bonds.
So, what causes the yield curve to change shape?
There are two levers that warp the shape of the yield curve - investors and central banks.
The central banks control the left side of the curve, influencing short-term bonds by altering the interest rates. When the economy is booming, the central banks raise short-term rates to reign in borrowing in an attempt to combat inflation. Inflation can rise in an expansionary economy if spending and borrowing get out of hand. We see the opposite with a stagnant economy; the central banks lower interest rates to encourage spending and borrowing. For the past 11 years the economy has been ticking upwards and the unemployment rate has been trending downwards. So central banks around the world, led by the FED, are betting it’s time to raise rates and restrict borrowing.
We, as investors, control the other half of the yield curve. As the confidence of investors grows and the economy trends in a positive direction, investors will take their money out of the bond market and invest in a riskier asset class like stocks. The lower demand of long-term bonds causes the price of the bonds to sink, pushing the yield curve up. This is important to note – bond prices are inversely related to interest rates, or yields. When investors think the economy is slowing they put their money into less risky assets such as long term bonds, which results in sinking yields and rising bond prices.
The yield curve inverting is an important marker for predicting recessions, though the measurements aren’t always perfect. Japan has had long stretches of inverted curves that didn’t lead to recessions and additionally, both the United Kingdom and Germany have had inversions without recessions. Yet, the previous five recessions began an average of 20 months after the 2-year/10-year yield curves inverted. Markets have done quite well initially after inversions with the S&P 500 Index not peaking until over a year after the inversions and gaining nearly 22%, on average, at the peak. However, the inversion of the yield curve is important because of the correlation between the rising rates and the lowering of investor sentiment.
So, what does the yield curve look like today?
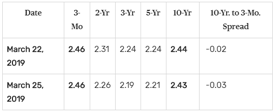
For some time now, the yield curve has been flattening. At the end of last year 10-year rates fell sharply as equity markets declined and many investors jumped to safety. On Friday, March 22, the Eurozone published weak economic data resulting in a further drop in 10-year yields. The US 10-year Treasury note fell below the three month T-Bill. It was the first time since 2007 that the curve inverted. Similar events happened in Canada through global developments having a massive impact on a monetary policy.

